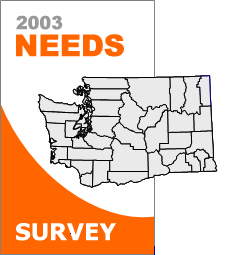
These tables contain updated estimates of the prevalence of substance use and the need for substance abuse treatment in Washington State from 2003 to 2010. These tables update the 2003 County Profile of Substance Use and Need for Treatment Services. Estimates were created using the Washington State Needs Assessment Household Survey (WANAHS), a statewide survey of 6,713 adults fielded from February 2003 through February 2004.
Select a county from the map or list to download:
WASHINGTON STATE
 Adams, Asotin, Benton, Chelan, Clallam, Clark, Columbia, Cowlitz, Douglas, Ferry, Franklin, Garfield, Grant, Grays Harbor, Island, Jefferson, King, Kitsap, Kittitas, Klickitat, Lewis, Lincoln, Mason, Okanogan, Pacific, Pend Oreille, Pierce, San Juan, Skagit, Skamania, Snohomish, Spokane, Stevens,Thurston, Wahkiakum, Walla Walla, Whatcom, Whitman, Yakima
Technical Notes
Funding was provided by a grant from the Federal Center for Substance Abuse Treatment. Further details about survey methods are provided in the state report, available electronically at 2003 Washington State Needs Assessment Household Survey (WANAHS) home page.
Population Groups for Analysis
Overall prevalence estimates are provided for three population groups:
All adult household residents: Household residents aged 18+, regardless of income Adults above 200% FPL: Household residents aged 18+ living above 200 percent of the federal poverty level (FPL) Adults at or below 200% FPL: Household residents aged 18+ living at or below 200 percent of FPL
Method for Estimating Prevalence Rates
To derive updated estimates for substance use and the need for substance abuse treatment from the WANAHS survey, we used US Census and Washington State Office of Financial Management (OFM) population estimates to construct a demographically specified population matrix for each county from 2003 to 2010, against which the 2003 survey-based prevalence rates could be applied. The population matrix contained counts of persons in demographic groups defined by age, sex, race/ethnicity, and poverty status. These estimates may be revised in the future as OFM releases updated population estimates.
Differences between counties in estimated rates of substance use and need for treatment result from differences in the demography of the counties. For example, counties with higher proportions of young adults will have higher estimated rates of current illicit drug use than counties with lower proportions of young adults, because young adults are more likely to be currently using illicit drugs. This method of developing prevalence estimates is called synthetic estimation.
